Blog
3 market trends from Ecommerce Berlin 2023
Ecommerce Berlin Expo 2023 wrap up. In this article, you'll get a personal overview of three significant trends I noticed this year at the Ecommerce...
Order volume across Romanian online shops has essentially stopped growing. Between January and August 2026, comparable Romanian shops processed 1% more orders than in the same months of 2025. Over the same stretch a year earlier, those same shops grew 10%.
We looked at 32 months of order data from 309 Romanian shops to work out what is going on. The market has not collapsed. The growth has moved. Smaller shops are still gaining, and the largest ones are not.
The eight months split cleanly in two. January to May ran 2% below the same months of 2025. June to August ran 6% above.
August was the strongest month in the three-year series. Two thirds of shops grew that month, and the median shop grew 14%. That is broad enough to rule out one large account moving the total.
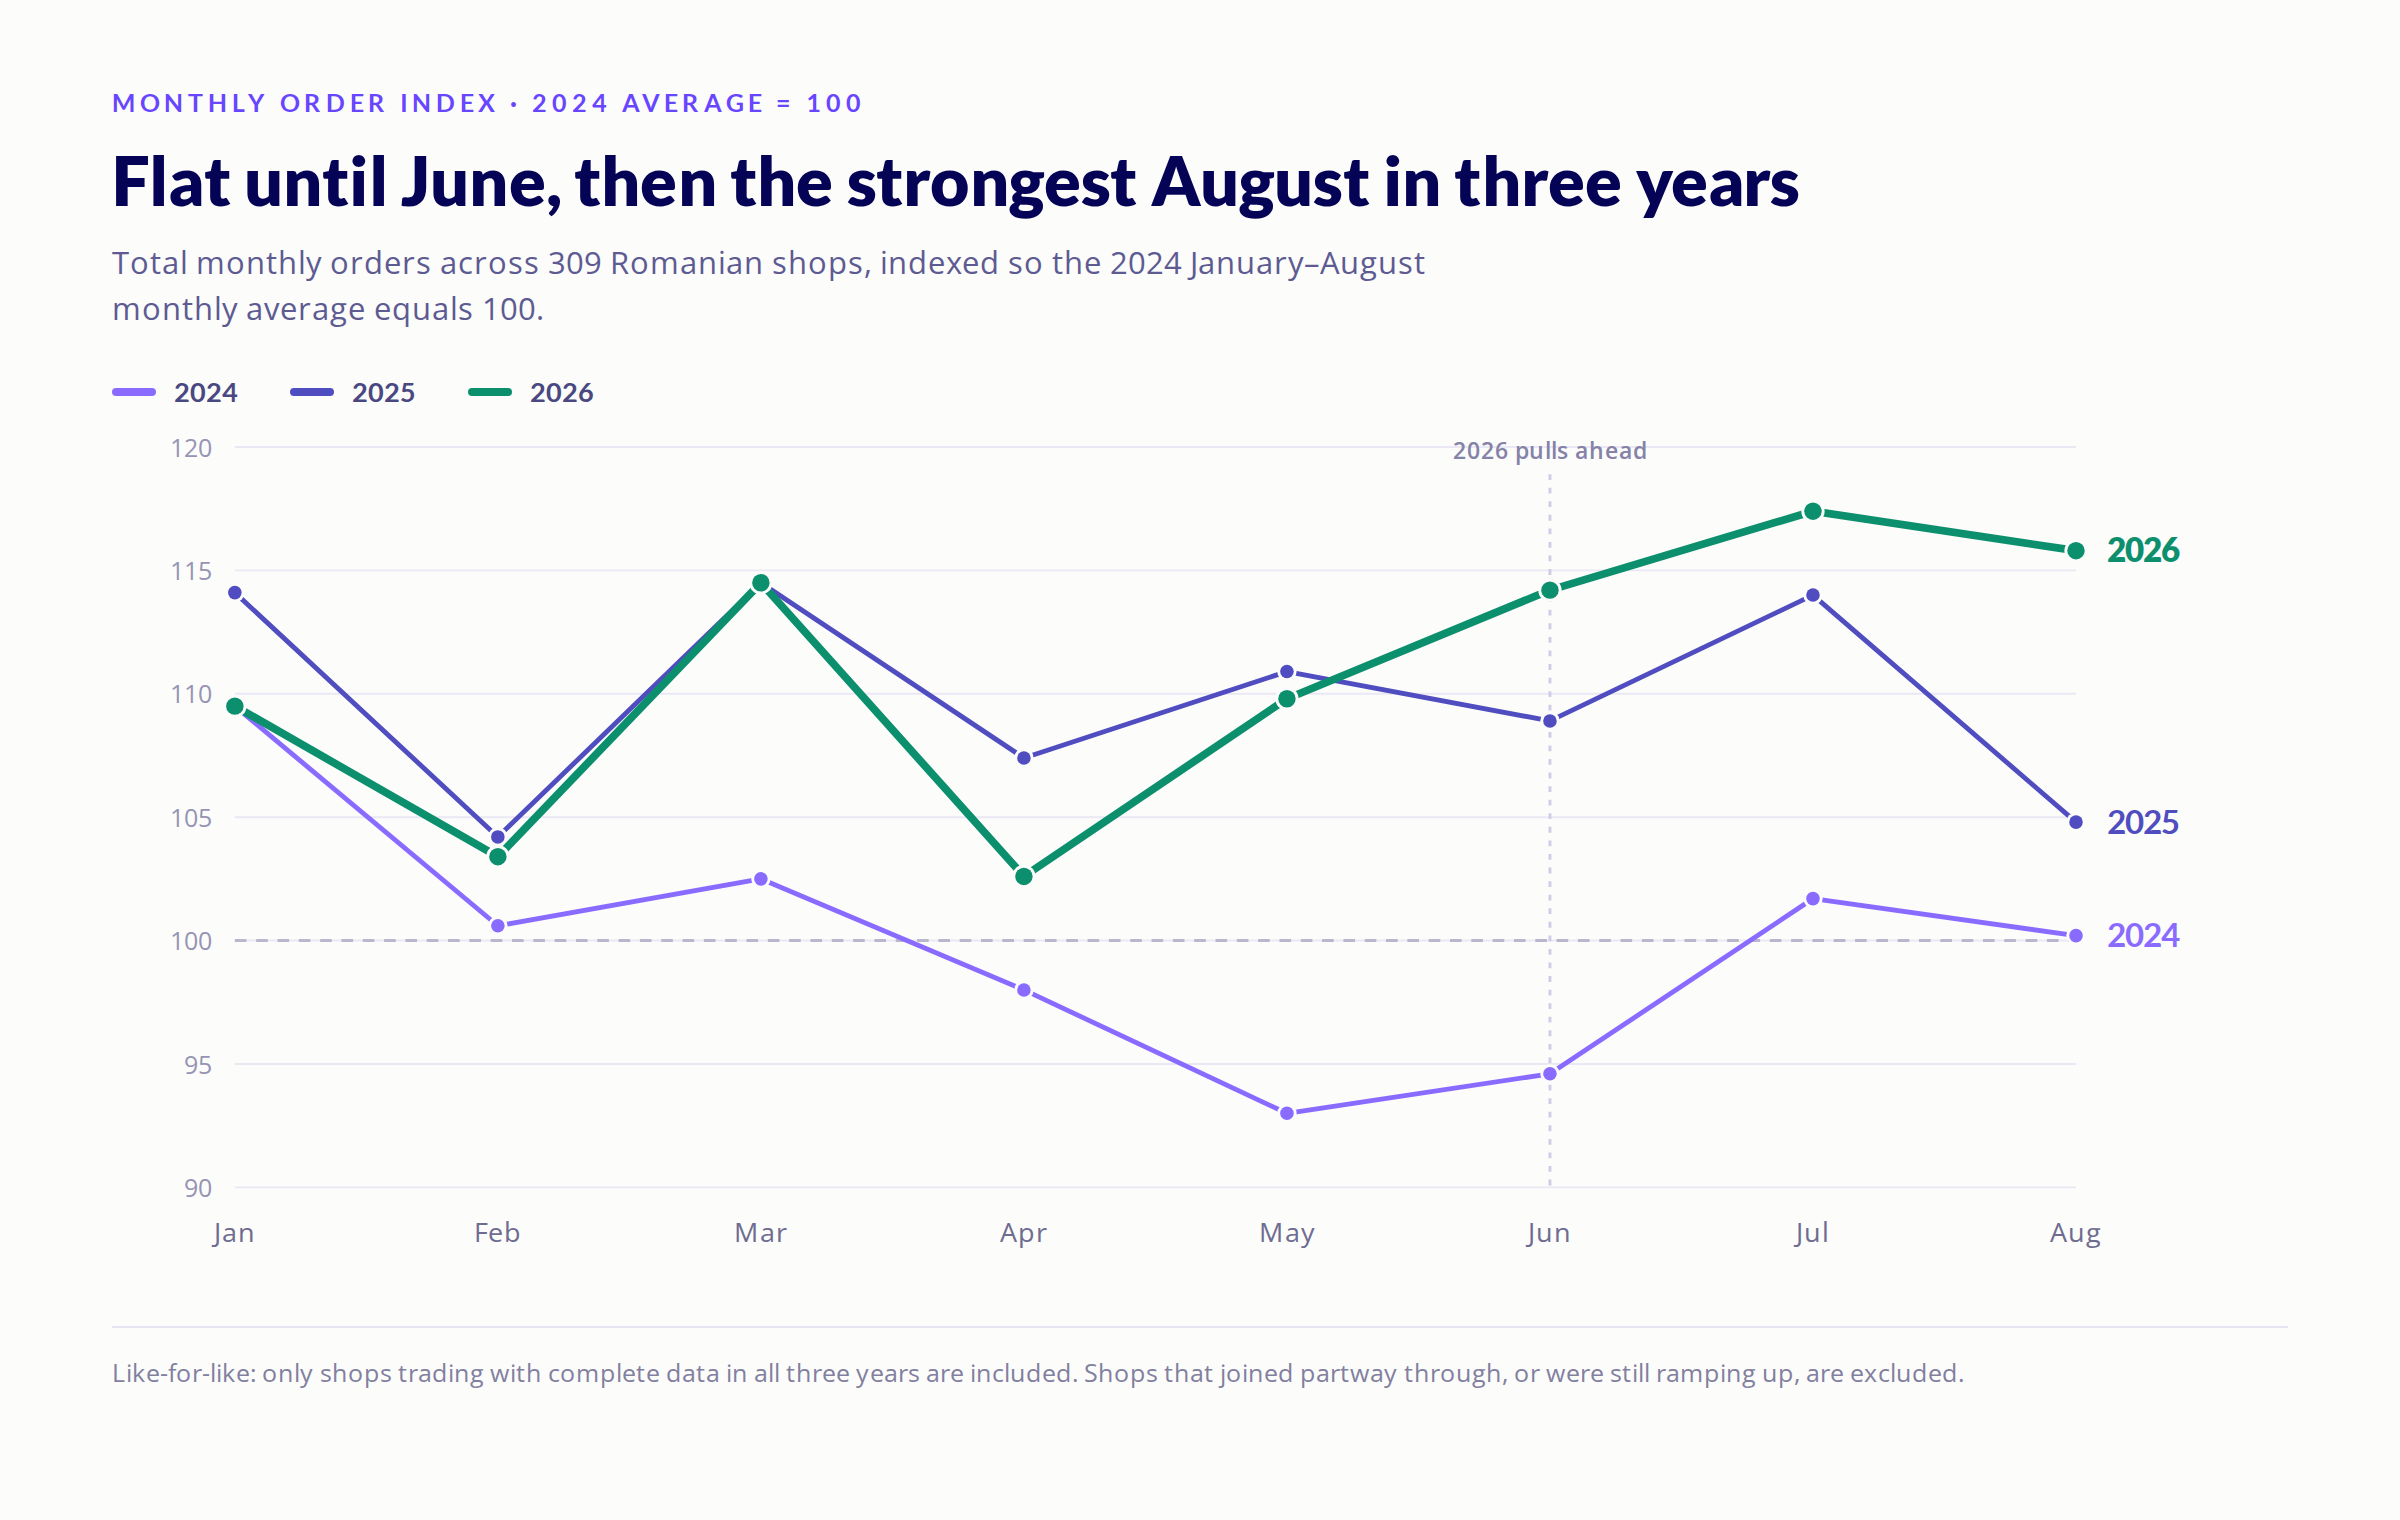
Two readings are available. Either the first half was weak and demand is recovering, or the summer benefited from something that will not repeat. We will know by December.
What is already clear is that a plan built on the January to May numbers looks different from one built on June to August.
This is the sharpest pattern in the data, and it runs in a straight line.
| Shop size | Order growth | Median shop | Share growing |
|---|---|---|---|
| Under 100 orders/month | +68% | +50% | 65% |
| 100 to 500 | +17% | +10% | 63% |
| 500 to 2,000 | +7% | +3% | 55% |
| Over 2,000 | -1% | -7% | 44% |
Read this carefully, because it invites the wrong conclusion. A shop going from 30 to 50 orders a month is up 67% and has added almost nothing in volume. Percentage growth at the small end is loud and light.
What the table actually shows is the top of the market slowing down. Shops above 2,000 orders a month shrank, and fewer than half of them grew at all. These are established businesses with real traffic, real catalogues and real budget, and they are running out of road on the tactics that worked in 2024.
It also explains a gap that would otherwise look strange. Total volume grew 2.1% while the median shop grew 5.8%. The typical Romanian shop is doing fine. The weight sits with the large ones, and the large ones are flat.
| Category | 2026 vs 2025 | 2025 vs 2024 |
|---|---|---|
| Home & Garden | +24% | -3% |
| Apparel & Accessories | +16% | +23% |
| Hardware and DIY | +7% | +29% |
| Electronics | +4% | +10% |
| Multi-category shops | -1% | -8% |
| Health & Beauty | -6% | +7% |
Home & Garden is the biggest swing, from -3% to +24%, and it is spread across many shops rather than driven by one. Health & Beauty went the other way, from +7% to -6%.
Hardware is the one to watch. Still positive at +7%, but down from +29% a year earlier. A category can look healthy and be decelerating hard at the same time.
Flat order volume in a market where traffic costs keep climbing means the growth has to come from the visitors you already have. Three things follow from the data.
Check how you are counting. If your year-on-year figure quietly includes a new storefront, a new marketplace channel or a category you did not sell last year, split it out. The like-for-like number is the one that tells you whether the core business is growing.
Do not read your category average as your ceiling. In every category we looked at, including the declining ones, some shops grew and some shrank. Health & Beauty fell 6% overall while 41% of its shops still grew. The spread within a category is wider than the gap between categories.
If you are above 2,000 orders a month, the old playbook has stopped paying. This is the segment where growth disappeared. More traffic is the expensive answer. Converting more of the traffic you already buy is the cheaper one, and it is where relevant on-site recommendations and search that actually finds the product do their work.
Monthly order counts from 309 Romanian online shops, January 2024 to August 2026. All growth figures are like-for-like, comparing only shops trading with complete data in both periods. Shops that joined partway through, or were still ramping up, are excluded. One-off data artifacts such as historical backfills at migration are removed. Seasonal peaks, including Black Friday and December, are preserved. Where a total and a median disagree, both are shown.
Ecommerce Berlin Expo 2023 wrap up. In this article, you'll get a personal overview of three significant trends I noticed this year at the Ecommerce...
What is AI in eCommerce and which are the top 10 tools you should know about? We put together a list of 10 AI tools that can help grow your eCommerce...
It can be challenging to choose the right product recommendation engine for your eCommerce shop. Here's a list of the 9 must-have features you should...